This is my first entry in English so I would like to apologize upfront if there are any language mistakes. If you find anything that needs correction, please feel free to contact me and I will gladly make the changes based on your suggestions
In the same
way we monitor our physical servers, it is necessary to monitor our VM.
Now that we
have a Virtual Machin in Azure, I will explain how to enable and configure how
to monitor it.
For that, I
will use the new Azure Portal, Ibiza. It stills in Preview, but it is
functional.
This is the
URL

To configure
the monitoring it is necessary an Azure Storage Account where the monitor data
will be stored, so the first step is to create a Storage Account in the same
region that our VM is.
Go to
Browse and select Storage Accounts. You can see there is another section called
Storage Accounts (Classic). There you can find the Storages Accounts created in
the old Portal.

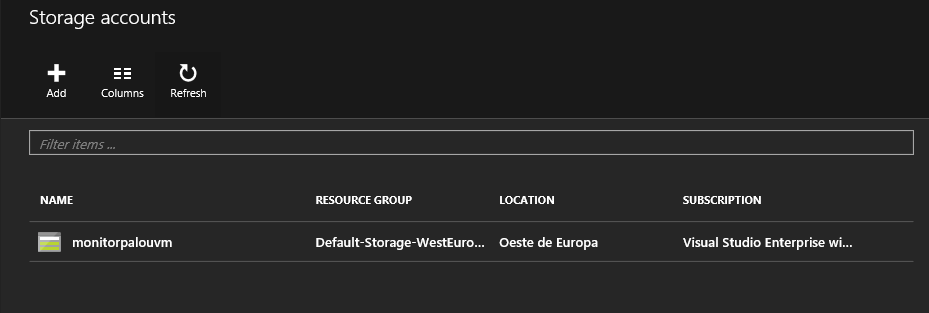
Once in the
Storage Accounts section, press ADD

A new slide
appears. Here we assign a name to the Storage Account and select the Resource
Group and the Location (remember, the Location must be the same where the VM
is).

In the
upper right corner, with the BELL symbol, you can watch the progress of the
deployment.

When the deployment is finished, just refresh with the circular
arrow

We can configure the VM monitoring yet. In our case, we
will find it in Virtual Machines (classic) because it was created in the old
Portal.

Click on the VM and a slide appears. Here we can see the
all the data about the VM and another slide with the settings. In the lower
part there is a tile called Monitoring where there is a message offering to
turn on the diagnostics, but we are going to use the Diagnostics menu item in
the right.

In the new slide, press ON to enable the diagnostics
options. The first thing is to select the Storage Account configured previusly.

And then, select the parameters we want to monitor. In this case, we are not going to monitor
.NET, SQL or IIS. But remember to check the Boot Diagnostics. And when you have
finished of choice the options you want to monitor, press SAVE.

Now we can start the VM and wait for the data to see the
charts change.

We can add some alerts now. They are useful to be aware of
some important metrics of our VM. Press on Alert Rules and then Add Alert.


In this example, it will send an email to the EMAIL@EMAIL.COM address when the percentage
of memory used is greather than 80% for 5 minutes.
