Mostrando entradas con la etiqueta microsoft. Mostrar todas las entradas

viernes, 5 de marzo de 2021

Script to add an alert to an Azure App Service using Powershell

With this script, you can add an alert about the number of HTTP errors to an Azure App Service.

The same script could be used to add any kind of alert to any kind of Azure Resource.

---------------------------------------------------

lunes, 6 de abril de 2020

Create a Logic App to increase the number of instances in one App Service Plan


The purpose of this procedure is to increase the number instances of one WebApp in an automatic way, triggering from one specific http request. For that, one pre-requisite is to have Application Insights enabled for that WebApp.

First, we need to get the App Service Plan configuration in json format. To do that, we can do a REST API call to retrieve the json.

1. Generate the App Service Plan management URL:

     a. In the Azure portal, we navigate to the App Service Plan and copy the URL.


     b. Modify the URL as the example:

https://portal.azure.com/dafd**ail.onmicrosoft.com/resource/subscriptions/d9ec***a286c474d612/resourceGroups/ScaleOut_Test/providers/Microsoft.Web/serverFarms/ ASP-ScaleOut***/webHostingPlan

https://management.azure.com/subscriptions/ d9ec*****a286c474d612/resourceGroups/ScaleOut_Test/providers/Microsoft.Web/serverFarms/ASP-ScaleOut***?api-version=2019-08-01

2. We need to generate a bearer to authenticate. 

     a. An easy way is to use this site: 


     b. Click on TRY IT and authenticate with some credentials valid in the subscription, and you will get a temporary valid token.


3. Now we can use the App Service Plan management URL and the token to retrieve the json. We are going to use the tool Postman:


The next step is to get the information for the API Access of the Application Insights. We got this information in the Azure Portal. The information we need is the Application ID and one valid API Key.


To authenticate the REST API request we will launch to modify the App Service Plan, we are going to use an AAD APP, and we assign Owner permissions to this APP.


Now we can create the Logic App:
1. In the Azure Portal, go to the Logic Apps section and add a new Logic App.


2. The Logic App first trigger will be based in Recurrence:


3. Add and configure a new one step of type Application Insights - Run Analytics Query:


     a. Configure the Application Insights connection with the API Access information


     b. Configure the query we want to execute to see if the request has been registered in the WebApp:


4. Add and configure a new one step of type Control – For Each


     a. Add a Dynamic Content of “Value”:


     b. Add an action of type Control – Condition:


     c. Add a Dynamic Content of “Content_”


     d. And configure the condition as count is greater than or equal to 1


5. In the “If true”  column, add a new HTTP action:


     Configure the HTTP request as the example:


6. In the “If true”  column, add a new SMTP – Send Email (V3) action:


     a. Create an SMTP connection, with your SMTP server/user:


     b. Configure the outgoing email with the parameters you prefer, for example:


7. Finally, save the new Logic App


And if you want to verify if the change in the number of instances has been successful, check in the Web App, the sections Scale Out (App Service Plan) and Process Explorer:


sábado, 6 de mayo de 2017

Monitorizar App Services en el Portal de Azure


Recientemente han vuelto a modificar en el Portal Ibiza de Azure las opciones para monitorizar las webapps (App Services), por lo que voy a tratar de explicar un poco las opciones que tenemos para monitorizar nuestra página web alojada en Microsoft Azure. Estas herramientas nos ayudarán a determinar el rendimiento y posibles problemas que esté sufriendo nuestro sistema.
Ahora hay que entrar desde “Diagnose and Solve Problems”.Diagnose and solve problems - app service - azure


Nada más abrir esa opción podemos ver una gráfica con el status de las últimas 24h  y podemos intercambiar entre Availability, Requests y Performance.


Diagnose and solve problems - app service - azure

Diagnose and solve problems - app service - azure

Diagnose and solve problems - app service - azure


También hay una zona con Herramientas útiles para diagnosticar el estado del WebApp. Voy a intentar explicar un poco cada una de ellas:
Diagnose and solve problems - app service - azure


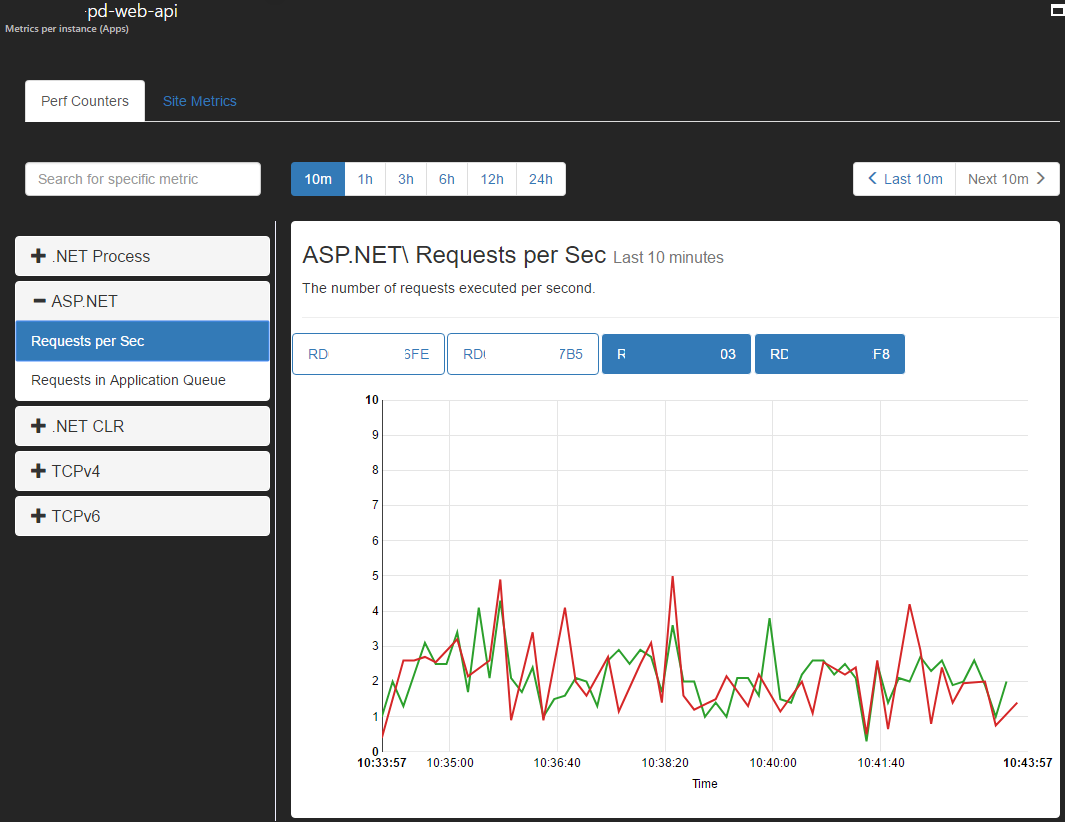
  • Metrics per instance (Apps):

En esta sección podemos revisar múltiples contadores de rendimiento (.NET Process, ASP.NET, .NET CLR, TCPv4 y TCPv6) y en distintos intervalos de tiempo, viendo las mismas en todas las instancias a la vez o indicando manualmente que instancia queremos comprobar.

Diagnose and solve problems - app service - azure


También podemos ver las métricas del site, viendo las mismas en todas las instancias a la vez o indicando manualmente que instancia queremos monitorizar.

Diagnose and solve problems - app service - azure


  • Metrics per instance (App Service Plan)
Aquí podemos ver las métricas de las instancias del Service Plan, viendo todas las APPS que comparten dichas instancias al estar en el mismo Service Plan, permitiendo ver también las métricas de los slots de staging. Podemos filtrar por instancia, intervalo de tiempo y Sites.

Diagnose and solve problems - app service - azure

Diagnose and solve problems - app service - azure


  • Live HTTP Traffic

Como su nombre indica, podemos visualizar el tráfico recibido por el WebApp en tiempo real, viendo las peticiones correctas, así como los errores de servidor (5xx) y las peticiones erróneas (4xx)

Diagnose and solve problems - app service - azure


  • Application Events

Es un Visor de Eventos del IIS donde está alojado el WebApp.


Diagnose and solve problems - app service - azure


  • Failed Requests Tracing Logs (FREB)

Esta herramienta realiza un seguimiento basado en una solicitud y produce un archivo de registro (en formato .xml) que muestra eventos y notificaciones de los diversos módulos que trabajaron en la solicitud durante su ciclo de vida.
Se puede filtrar por la URL, por el tipo de petición, por la hora y fecha, por el código de estatus…

Diagnose and solve problems - app service - azure


  • Diagnostics as a Service

Permite lanzar una solicitud para recopilar información en forma de log y analizada en formato HTML del Visor de Eventos, de los logs HTTP y hacer un Memory Dump (utilizar el Memory Dump con cuidado, ya que puede provocar una caída del servicio) de la instancia.

Diagnose and solve problems - app service - azure


  • Mitigate

Permite crear reglas de auto-reciclado del WebApp basado en el número de peticiones en un determinado intervalo de tiempo.

Diagnose and solve problems - app service - azure

Diagnose and solve problems - app service - azure


  • Advanced Application Restart

El reinicio avanzado de aplicación le permite reiniciar instancias individuales de la aplicación y reiniciar de forma inteligente varias instancias. El temporizador de reinicio le permite especificar el intervalo de tiempo en segundos que se usa al reiniciar determinadas instancias de la aplicación y reducir el efecto de los arranques en frío.

Diagnose and solve problems - app service - azure


miércoles, 30 de septiembre de 2015

Monitoring a Virtual Machine in Azure

This is my first entry in English so I would like to apologize upfront if there are any language mistakes. If you find anything that needs correction, please feel free to contact me and I will gladly make the changes based on your suggestions


In the same way we monitor our physical servers, it is necessary to monitor our VM.

Now that we have a Virtual Machin in Azure, I will explain how to enable and configure how to monitor it.

For that, I will use the new Azure Portal, Ibiza. It stills in Preview, but it is functional.

This is the URL


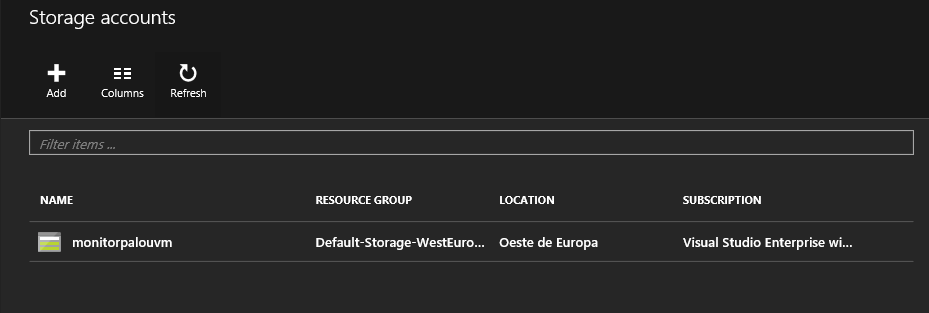
To configure the monitoring it is necessary an Azure Storage Account where the monitor data will be stored, so the first step is to create a Storage Account in the same region that our VM is.

Go to Browse and select Storage Accounts. You can see there is another section called Storage Accounts (Classic). There you can find the Storages Accounts created in the old Portal.


Once in the Storage Accounts section, press ADD


A new slide appears. Here we assign a name to the Storage Account and select the Resource Group and the Location (remember, the Location must be the same where the VM is).


In the upper right corner, with the BELL symbol, you can watch the progress of the deployment.


When the deployment is finished, just refresh with the circular arrow


We can configure the VM monitoring yet. In our case, we will find it in Virtual Machines (classic) because it was created in the old Portal.


Click on the VM and a slide appears. Here we can see the all the data about the VM and another slide with the settings. In the lower part there is a tile called Monitoring where there is a message offering to turn on the diagnostics, but we are going to use the Diagnostics menu item in the right.


In the new slide, press ON to enable the diagnostics options. The first thing is to select the Storage Account configured previusly.


And then, select the parameters we want to monitor.  In this case, we are not going to monitor .NET, SQL or IIS. But remember to check the Boot Diagnostics. And when you have finished of choice the options you want to monitor, press SAVE.


Now we can start the VM and wait for the data to see the charts change.


We can add some alerts now. They are useful to be aware of some important metrics of our VM. Press on Alert Rules and then Add Alert.


In this example, it will send an email to the EMAIL@EMAIL.COM address when the percentage of memory used is greather than 80% for 5 minutes.